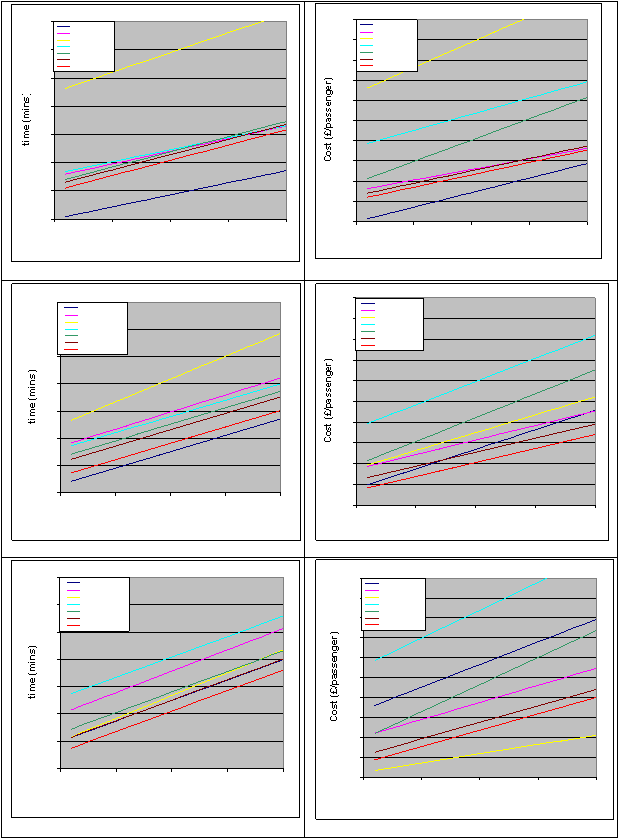
However, as demand increases (see figures 5 to 8) the COAST system becomes competitive with the private
car. This is due to its ability to use priority routes and parking spaces, and to pick up and drop passengers off at
nearly any location. In contrast, the car may be required to queue for long periods and park at a remote location.
This time advantage also explains why the cost of the COAST system is cheaper than any alternative in the
medium demand scenario and only the bus is cheaper than COAST in the high demand scenario. Note also that
the COAST system outperforms the conventional taxi in all modes in terms of time and cost.
0
10
20
30
40
50
60
70
0
5
10
15
20
Distance (km)
Private car
Shared car
Bus
Taxi
Shared Taxi
1% COAST
10% COAST
Figure 3 Low Demand Journey Times
0
2
4
6
8
10
12
14
16
18
20
0
5
10
15
20
Distance (km)
Private car
Shared car
Bus
Taxi
Shared Taxi
1% COAST
10% COAST
Figure 4 Low Demand Costs
0
10
20
30
40
50
60
70
0
5
10
15
20
Distance (km)
Private car
Shared car
Bus
Taxi
Shared Taxi
1% COAST
10% COAST
Figure 5 Medium Demand Journey Times
0
2
4
6
8
10
12
14
16
18
20
0
5
10
15
20
Distance (km)
Private car
Shared car
Bus
Taxi
Shared Taxi
1% COAST
10% COAST
Figure 6 Medium Demand Costs
0
10
20
30
40
50
60
70
0
5
10
15
20
Distance (km)
Private car
Shared car
Bus
Taxi
Shared Taxi
1% COAST
10% COAST
Figure 7 High Demand Journey Times
0
2
4
6
8
10
12
14
16
18
20
0
5
10
15
20
Distance (km)
Private car
Shared car
Bus
Taxi
Shared Taxi
1% COAST
10% COAST
Figure 8 High Demand Costs
Figures 3-8 Journey times and costs for various levels of transport demand

